Web platform, user manual⚓︎
Vidjil is an open-source platform for the analysis of high-throughput sequencing data from lymphocytes. V(D)J recombinations in lymphocytes are essential for immunological diversity. They are also useful markers of pathologies, and in leukemia, are used to quantify the minimal residual disease during patient follow-up. With adapted library preparation and sequencing, high-throughput sequencing (NGS/HTS) now enables the deep sequencing of a lymphoid population with dedicated sequencing methods and software, called either Rep-Seq or AIRR-Seq.
This is the help of the Vidjil web application. Further help can always be asked to support@vidjil.org. We can also arrange phone or video meeting.
The Vidjil team (Mathieu, Mikaël, Aurélien, Clément, Florian, Marc, Ryan and Tatiana)
Requirements⚓︎
Supported browsers⚓︎
The Vidjil web application runs in any modern browser. We recommend to either regularly update one's web browsers, or to use long-term releases, such as Firefox ESR. As of January 2024, we recommend using Firefox or Chrome/Chromium :
- Firefox, version >= 115 ESR
- Chrome, version >= 115
These platforms will be supported to at least April 2026. Within our quality process, we test several of these versions through tests and continuous integration.
Legacy browsers⚓︎
We also provide an extended support on
- Firefox, versions 78 to 114
- Chrome, version 79 to 114
Some of these legacy platforms are also tested through our continuous integration pipelines. However, old platforms have security flaws and are not recommended for routine usage involving clinical data. They may not get the new features, and this extended support will be dropped in May 2024.
Before dropping support to any platform, we display during at least six months a warning on those legacy browsers.
Other browsers⚓︎
Vidjil is also reported to work with recent Edge, Opera or Safari browsers, but these browsers are not officially supported. Note that Vidjil will not run on IE 9.0 or below.
Getting .vidjil files⚓︎
The vidjil web application displays .vidjil files that summarize the V(D)J
recombinations and the sequences found in one or several samples.
The easiest way to get these files is to request an account on the public Vidjil test server.
You will then be able to upload,
manage, process your samples (.fasta, .fastq, .gz, .bam, or .clntab files) directly on the web application
(see The sample database and the server), and the server behind the sample
database computes these .vidjil files with vidjil-algo.
Otherwise, such .vidjil files can be obtained either:
- running vidjil-algo from the command line (starting from
.fasta,.fastqor.gzfiles, see vidjil-algo documentation). To gather several.vidjilfiles, you have to use the fuse.py script - or by any other V(D)J analysis pipelines able to output files
respecting the
.vidjilfile format - or by using the fuse.py script on the standard AIRR representation
Contact us if you want help converting such data.
First aid⚓︎
-
Open data by:
-
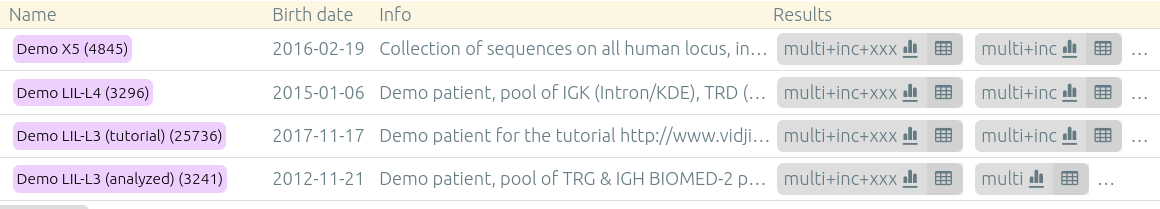
either with “samples”/“open samples” if you are connected to a sample database, such as on https://app.vidjil.org/ or https://health.vidjil.org/. In these cases, there are always some "Demo" datasets for demonstration purposes. Once a patient/run/set is selected, you can access the results by clicking on the link near
See results(bottom right). -
or with “file”/“import/export”, manually selecting a
.vidjilfile
-
-
You can change the number of displayed clonotypes by moving the slider “number of clonotypes” (menu “filter”). The maximal number of clonotypes that can be displayed depends on the processing step before. See below "Can I see all the clones ?".
-
clonotypes can be selected by clicking on them either in the list, on the sample graph, or the grid (simple selection or rectangle selection).
-
There are often very similar clonotypes, coming from either somatic hypermutations or from sequencing errors. You can select such clonotypes (for example those sharing a same V and a same J), then:
- inspect the sequences in the lower panel (possibly using the “align” function),
- remove some of these sequences from the selection (clicking on their name in the lower panel)
- cluster them (button “cluster”) in a unique clonotype. Once several clonotypes are clustered, you can still visualize them by clicking on “+” in the list of clonotypes.
-
Your analysis (clonotype tagging, renaming, clustering) can be saved:
- either with “samples”/“save analysis” if you are connected to a sample database
- or with “file”/“export .analysis”
-
You can focus on a particular locus by clicking on locus label in sample information panel (see below). This allows to see size of a clonotype in it own locus.
You are advised to go through to the tutorial available from https://www.vidjil.org/doc to learn the essential features of Vidjil.
The elements of the Vidjil web application⚓︎
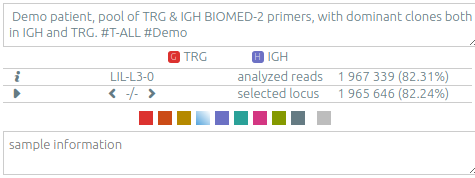
The info panel (upper left panel)⚓︎
-
patient/run/set information.
-
locus: Germline(s) used for analyzing the data. In case of multi-locus data, you can select what locus should be displayed (see Libraries and recombinations)
-
analysis: Name (without extension) of the loaded file.
-
sample: Name of the current sample.
-
date: Date of the current sample (can be edited in the database, on the patient/run/set tab). When displaying multiple samples from a same patient/run/set, you can change the sample viewed by clicking on the
←and→buttons, or cycle through them by clicking on the "▶" button. -
analyzed reads: Number of reads where the underlying RepSeq algorithm found a V(D)J recombination, for that sample. See Number of analyzed reads below. By hovering the mouse, one also sees the total number of reads for that sample.
-
The info “🛈” button opens the sample information panel, which includes metadata on the sample and its analysis. It includes information on the version and the parameters of the analysis software.
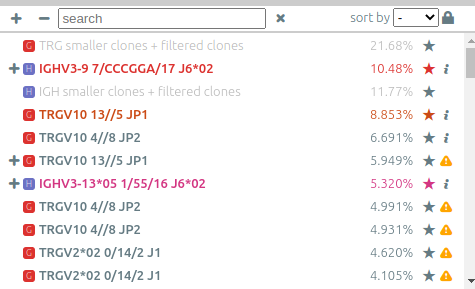
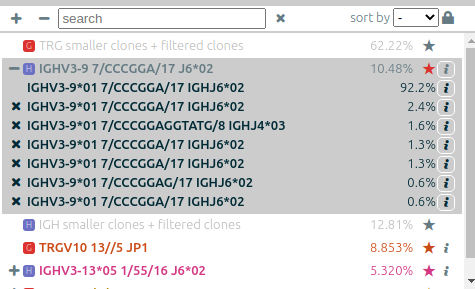
The list of clonotypes (left panel)⚓︎
When they were processed by vidjil-algo, clonotypes are described with identifiers
such as TRGV3*01 2/ATC/6 J1*02 that describes the V(D)J recombination.
Here the sequence was analyzed as
the V gene TRGV3*01, with 2 nucleotides deleted at its end (3'),
followed by a N region with the three nucleotides ATC,
then followed by the J gene TRGJ1*02, with 6 nucleotides deleted at its start (5').
-
You can adjust the way that these clonotype names are displayed through the menu options “settings > N regions in clonotype names” and “settings > alleles in clonotype names”.
-
You can assign other tags with colors to clonotypes using the “★” button. The “filter” menu allows to further filter clonotypes by tags.
-
Under the “★” button it is possible to normalize clonotype concentrations according to this clonotype. You must specify the expected concentration in the “expected size” field (e.g. 0.01 for 1%). See Control with standard/spike below.
-
The list can be sorted on V genes, J genes or clonotype abundance. The “+” and “-” allow respectively to un-cluster or re-cluster all clonotypes that have already been clustered.
-
Clonotypes can be searched (“search” box) by either their name, their custom name, their DNA sequence, their (partial) CDR3 amino acid sequence.
-
The concentration of some clonotypes may not be displayed.
- A clonotype with a plus symbol
+has been detected in that sample, but with only a few reads, typically less than five. Its concentration ratio is thus not significant, and this clonotype would appear in the gray zone in the sample graph. - A clonotype with a minus symbol
−has not been detected in that sample, but has been detected in another sample that is not currently displayed.
- A clonotype with a plus symbol
Detailed information on each clonotype⚓︎
The “🛈” button opens a window showing detailed information (V(D)J designation, e-value, number of reads) about each clonotype.
In addition, depending on what the user launched on this clonotype, we may also find detailed information retrieved from IMGT or from CloneDB.
Detailed information from CloneDB⚓︎
(experimental feature) If you are connected to a sample database where CloneDB is enabled, and if CloneDB was launched on the selected clonotype, you can see here occurrences of this clonotype in CloneDB as well as links to the relevant patients/runs/sets. Note that the percentage shown can be above 100% as the percentage is calculated over all the samples in the sample set.
The sample graph⚓︎
The sample graph is displayed as soon as there are at least two samples. It shows the most frequent clonotypes of each sample, tracked into every sample.
-
The current sample is highlighted with a vertical gray bar. You can select another sample by clicking on it or using
←and→. -
By default, the graph shows clonotypes present in the top 20 of any sample. See below "Can I see all the clones ?". You can instead choose to show only the clonotypes present in the current sample with “filter > focus on clonotypes of one sample“.
-
When a clonotype gathers very few reads, typically less than five, its concentration ratio is not significant and it is shown by a
+in the clonotype list. Such clonotypes appear in the sample graph in a gray zone. They should be considered as “detected, but not quantifiable“, and different concentrations in the gray zone should not be compared. -
Samples can be reordered by dragging their label.
-
Samples can be hidden by double-clicking on their label. At the top-right of the graph, a button such as
5/8shows how many samples are displayed (here5) and the total number of samples (here8). This button reveals a menu where each sample can be selected (single click), shown or hidden (double click), as well as options to show or to hide all samples. -
If your dataset contains sampling dates (for example for diagnosis/follow-up samples), you can switch between sample keys and dates in “settings > sample key”

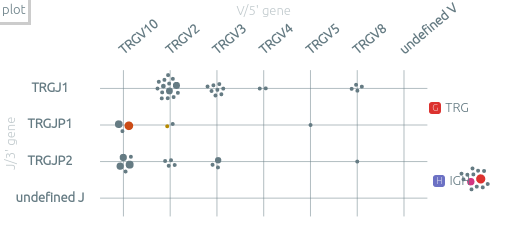
The plot view and the plot presets⚓︎
The grid view shows the clonotypes scattered according to some axes. When there is only one sample, two such views are shown.
-
The default view, by V/J genes, focus on one recombination system within one locus. All the analyzes locus are on the right of the grid. You can select another locus by clicking on it or by using the associated shortcuts (see Keyboard shortcuts below).
-
The “plot“ menu allows to customize the plots, by selecting the X and Y axes, by switching between grid and bar plots, and also by saving plots for the next report. There are 20+ available axes to study the clonotypes. Some presets are available. For example, the preset 4, similar to a "Genescan analysis", shows a bar plot of the clonotypes according to the length of their consensus sequence, and the preset 7 shows the distribution of CDR3 lengths.
-
On the bar plots, the Y axis corresponds to the order of clonotypes inside each bar.
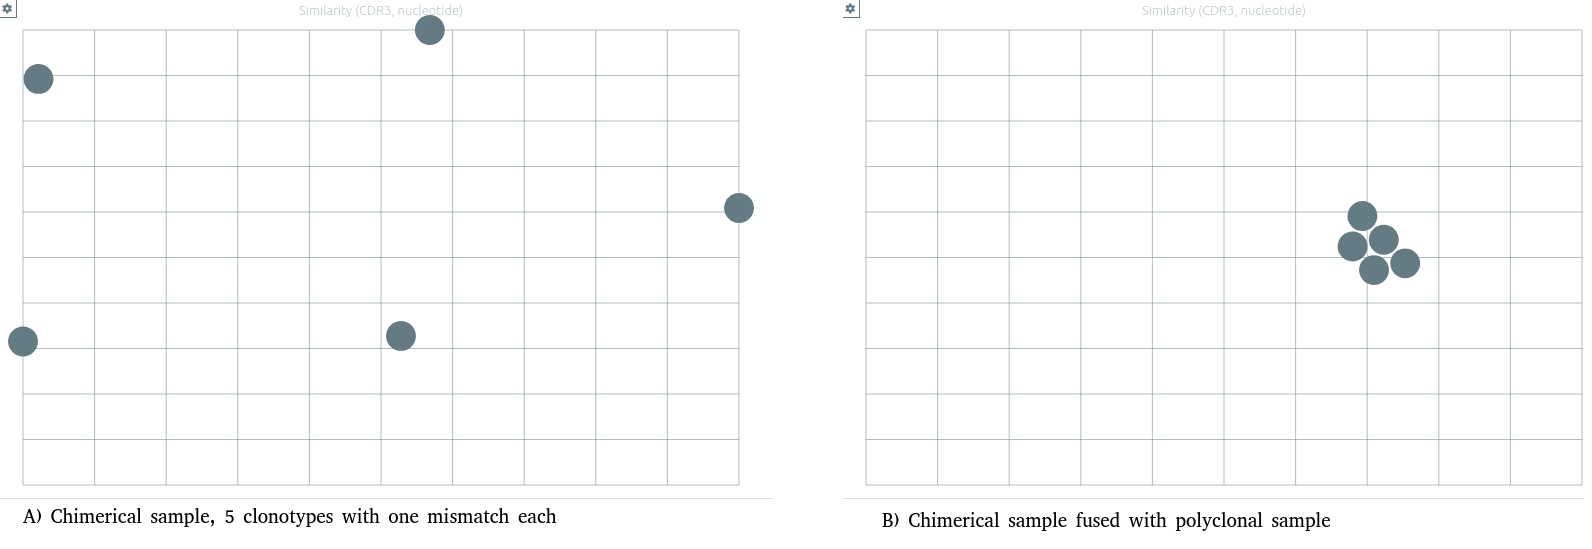
Similarity between clonotypes⚓︎
A particular preset for similarity is available.
Similarity values are now computed on vidjil windows sequences (centered on CDR3 of the clonotype, with a length depending of analysis preset).
The "Similarity by nucleotides" preset computes the similarity between each pair of clonotypes, and displays clonotypes on a 2D plane, split by locus, with the tSNE algorithm.
Warning
The similarity is computed only on clonotypes present on the current samples. The same clonotypes will thus be displayed further apart on smaller samples with more similar clones. In most cases, the more dissimilarity there is among the clonotypes of the sample, the better the clonotypes are grouped.
Note that when another analysis produce a slightly different list of clonotypes (launching another configuration, adding samples...), the tSNE algorithm will be relaunched and the 2D projection may look slightly different.
Status bar⚓︎
-
At the bottom of the plot view, the “status bar“ displays information on the selected clonotype.
-
The “focus“ button (status bar, bottom right) allows to further analyze a selection of clonotypes, and the “hide” button allows to hide some clonotypes. To exit the focus/hide mode, click on the “X” near the search box. To further analyze a set of clonotypes sharing a same V and J, it is often useful to focus on the clonotypes, then to display them according either to their “clonotype length” or their “N length” (that is N1-D-N2 in the case of VDJ recombinations).
-
The “★” button (status bar, bottom right) allows to tag all the selected clonotypes at once and/or to select them for the next report.
The sequence panel (bottom panel)⚓︎
The sequence panel shows, for the selected clonotypes:
- the nucleotide or amino acid sequences -- see below "What is the sequence displayed for each clone ?"
- some features on these sequences
Align⚓︎
The align button aligns all the selected sequences,
the sequence of the first (largest) clonotype used as a reference.
.is a match-is a gap- a single line under a character is a nucleotide mismatch
- a double line under a character is a silent nucleotide mismatch (not impacting the resulting amino acid sequence)
*in an amino acid sequence indicates a stop codon#in an amino acid sequence indicates a frameshift in the junction (and thus an unproductive sequence)
The alignment settings ⚙ menu allows to customize such alignments, by
- highlighting mismatches
- hiding matches
- switching between amino acid and nucleotide sequences
Data Columns⚓︎
The analysis software, on some configurations, may provide additional data
axes for each clonotype.
The data columns ‖ menu allows to select such data.
External Analysis: Further sequence analysis with external software⚓︎
This sub menu display a range of other analysis software available online used for RepSeq studies. These buttons will send the sequences of selected clonotypes to them for analysis and open the resulting page in another window/tab.
-
❯ IMGT/V-QUEST: The reference analysis from IMGT®, including search for subset#2and#8. See below -
❯ IgBlast: Nucleotide alignment with IG/TR germline sequences -
❯ CloneDB. See above -
❯ Blast: Nucleotide alignment against the Homo sapiens genome and other nucleotide collections -
❯ AssignSubsets(available for clones with IGH recombinations): Assignment to the 19 known major subsets of stereotyped antigen receptor sequences for CLL
Sequence Features⚓︎
Depending on the analysis software and on its configuration, there can be positions of genes or specific regions of interest that can be highlighted.
The sequence feature ☰ menu usually contains at least the following genes/regions:
- V/D/J genes
- CDR3 position
- Primers as computed after selection of a primer set
IMGT Sequence Features⚓︎
The ☰ IMGT menu further allows to select features provided by IMGT/V-QUEST:
- V/D/J genes
- FR1/FR2/FR3/FR4
- CDR1/CDR2/CDR3
To avoid overloading the IMGT servers that provide us this feature,
after adding new clonotypes to the selection,
one has to click on the refresh ↻ button to request the features for the new sequences.
Exporting reports⚓︎
To export reports from your data, you may first select clonotypes and/or plots:
-
Select some clonotypes by using the “★” button (status bar, bottom right), and
add to next report. -
On any grid or bar plot, open the “plot“ menu and again
add to next report. The report will show these plots with the same parameters (X/Y axes, clonotype/axes filters).
Then select export report inside the menu import/export.
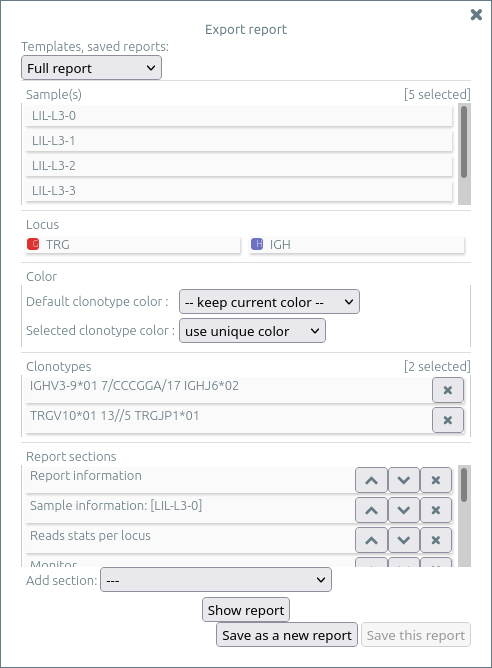
The report menu allows to select a template and to load a previously saved report, and to customize the report by:
- Showing or hiding any sample (NB: use shift key to invert selection)
- Showing or hiding any locus (NB: use shift key to invert selection)
- Selecting the colors for all clonotypes and for selected clonotypes
- Updating the clonotypes you previously selected (with “★”), possibly removing them for the report
- Adding, moving, or deleting reports sections, including plots you previously selected (within the “plot“ menu)
This (possibly customized) report can be saved for later reuse. Saved reports are stored when you "save" the analysis on a patient/sample. If you need other customized templates, please contact us.
Show report⚓︎
Show report opens the report in a new browser tab.
When a section is hovered, some icons at the top right allow to
move that section (up/down),
delete that section,
and finally, under the current section,
to add a comment section where you can enter a free text.
Both regular and comment sections will be saved when you save the report.
Warnings view⚓︎
The warning view (new in release 2023.03) lists global and clonotype warnings. Clonotypes with a specific warning can be selected (🔍), either from the current sample or from all samples.
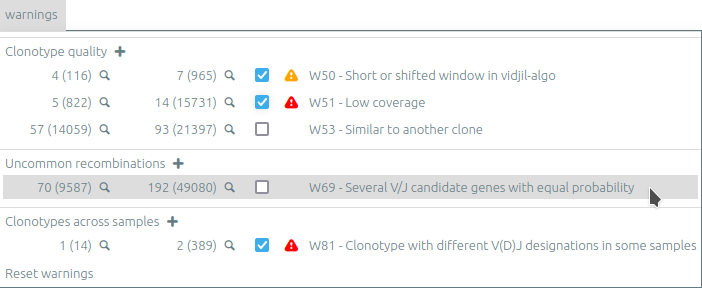
Warnings can be muted by unchecking the checkbox. Muted warnings are still listed on the clonotype information panel or on hover of the “🛈” icon of each clonotype.
The sample database and the server⚓︎
If a server with a sample database is configured with your installation of Vidjil (as on the public test server https://app.vidjil.org/ or on the healthcare server https://health.vidjil.org/), the 'samples' menu gives you access to the server.
With authentication, you can add 'patients', 'runs', or 'sets', they are just three different ways to group 'samples'.
Samples are .fasta, .fastq, .gz or .clntab files, possibly pre-processed.
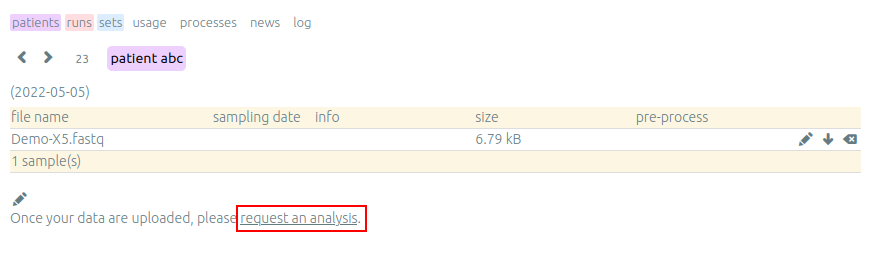
Once you uploaded samples (either in 'patients', 'runs', or 'sets'),
you can process your data and save the results of your analysis.
Patients⚓︎
Warning
The public https://app.vidjil.org/ server is for Research Use Only and is not compliant for clinical use. Clinical data have to be uploaded on a certified healthcare server.
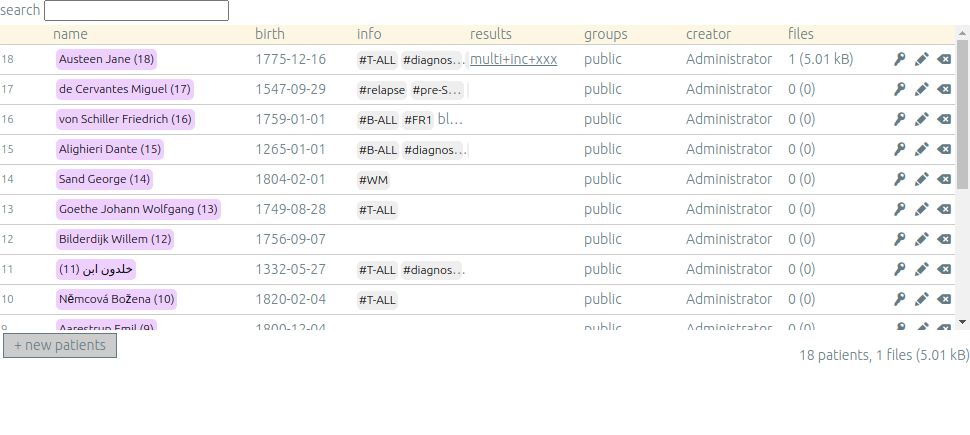
Once you are authenticated, this page shows the patient list. Here you can see your patients and patients whose permission has been given to you.
New patients can be added (+ new patients), edited (✏️) or deleted (⌫).
By default, you are the only one who can see and update this new patient.
If you have an admin access, you can grant access to other users (p).
Runs and sets⚓︎
Runs and sets can be manipulated the same way as patients. They can be added (+ new runs, + new sets),
edited (✏️) or deleted (⌫).
They are just different ways to group samples.
Sets can for example gather a set of samples of a same experiment.
Runs can be used to gather samples that have been sequenced in the same run.
Batch creation of patients/runs/sets⚓︎
Patients, runs and sets can be added one by one (add patient, add run, add set).
They can also be created by pasting data from a properly formatted table
created by any spreadsheet editor such as LibreCalc/LibreOffice or Excel.
Data has to be presented with the following columns, but some cells may be empty. Do not copy any header row, but only the data rows.
Patient : 5 columns (patient id, first name, last name, birth date, info)
| 42 | John | Doe | #ALL | |
| George | Sand | 1804-02-01 |
Run : 4 columns (run id, name, date, info)
| 2020r84 | Lib84 | 2020-09-15 | |
| 2020r85 | Lib85 | 2020-09-15 | new IGH-DJ primers |
Set : 2 columns (set name, info)
| CohortCLL | Retrospective 2015-2019 |
| Mouse1604 |
First analysis⚓︎
First analysis is launched by us and provides a help to users in need. It helps new users to interpret data and detect some notable things about their samples with your support. This is also a good starting point if you have specific data or protocols and require a particular configuration or setup for work on the server.
After a first analysis, we give you the right to launch your own pipelines on the vidjil server. Then, you can choose from a list of configurations that suit your data and launch analysis by clicking on the gear icon.
Permanent address (URL) to a set of samples⚓︎
Addresses such as https://app.vidjil.org/3241-25 directly target a set of samples (here the public dataset L3), possibly with your saved analysis. Moreover, the address may also encode other parameters, for instance https://app.vidjil.org/3241-25?plot=clonotype%20average%20read%20length,J/3%27%20gene,bar&clone=30 (selected axes and selected clonotypes).
To discuss on some results or to raise any issue, you can share such addresses with other users (with whom you share access grants, see below), to your local IT staff or to the Vidjil team.
Samples and pre-processes⚓︎
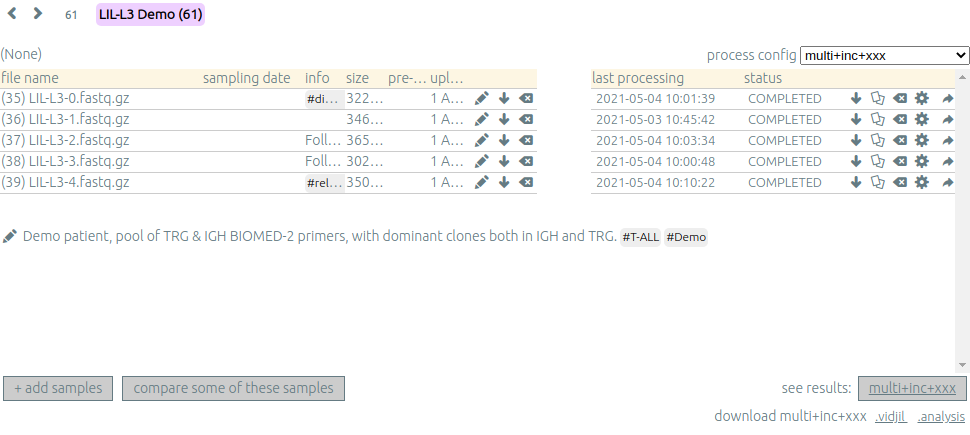
Clicking on a patient, a run or a set give access to the "samples" page. Each sample is
a .fasta, .fastq, .gz or .clntab file that will be processed by one or several
pipelines with one or several process configurations that set software options.
Depending on your granted access, you can add a new sample to the list (+ add samples),
download sample files when they are available (⬇) or delete sequence files (⌫).
Note that sample files may be deleted (in particular to save server disk space),
which is not the case for the results (unless the user wants so).
You can see which samples have been processed with the selected
process, and access to the results (See results, bottom right).
Adding a sample⚓︎
To add a sample (+ add samples), you must add at least one sample file. Each sample file must
be linked to a patient, a run or a set. One of those fields will be automatically
completed depending on whether you accessed the sample page.
These fields provide autocompletion to help you enter the correct
patient, run or sets. It is advised to fill in both fields (when it makes
sense). However please note that the corresponding patients, runs and sets must have
been created beforehand.
Pre-processing⚓︎
The sample files may be preprocessed, by selecting a pre-process scenario when adding a sample.
This will definitivly modify original sample file and change of it will enforce to reupload dat a ofr this sample.
At the moment, we offer 4 kind of preprocess.
-
Read merging
People using Illumina sequencers may sequence paired-end R1/R2 fragments. It is highly recommended to merge those reads in order to have a read that consists of the whole DNA fragment instead of split fragments. To merge R1/R2 fragments, select an adapted pre-process scenario and provide both R1/R2 files at once when adding a sample. On the public test server, the default scenarios use the Flash2 read merger with the option-M 300.
There are two scenarios to merge reads. Indeed in case the merging is not possible for some paired-end reads we must keep only one of the fragments (either R1 or R2). We cannot keep both because it would bias the quantification (as there would be two unmerged reads instead of one). Depending on the sequencing strategy it could be better to keep R1 or R2 in such a case. Therefore it really depends on users and their sequencing protocols. You must choose to keep the fragment that most probably contains both a part of the V and the J genes. -
UMI demultiplexing
For people using UMI to debias amplficiation, we include a UMI demultiplexing process. It use calib software and are set to use 2x3nt UMI by default. -
VDJ prefilter
Some people use now Capture or WGS sequencing. In such cases, VDJ data represent only a very few part of the original file. So we include a process that will make a first and very quick prefilter of vdj reads and keep every reads that have at least some kmer from germline database. This step allow to keep a small dataset for further analysis pipeline, that will be greatly improve in time, and to save disk space on server. -
Primer dimer prefilter
Sometimes, user have primer dimers in there dataset that will contaminate sample analysis. In this case, we put a simple filter on reads that are under 60nt that are mainly artifact sequence.
Note that we can also mix some of these preprocess at the same time in one preprocess configuration.
Preprocess in this case follow this order:
graph LR
  A[UMI demultiplexing];
  B[Reads Merging R1/R2];
  C[VDJ prefiltering];
  D[Primer dimer prefiltering];

  A --> B;
  B --> C;
  C --> D;
These preprocess follow scripts available in contributions repository. If you already have some local preprocess not listed here that you want to include in your vidjil pipeline, or that you want to share it with community, don't hesite to concat us.
Processing samples and process configurations⚓︎
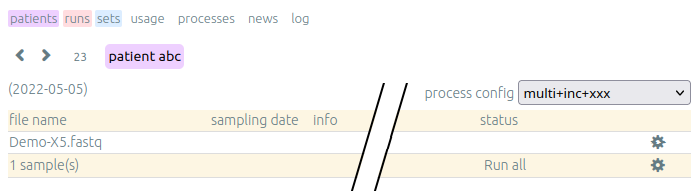
Depending on your granted accesses, you can schedule a processing for a sequence file (select a config and run).
The processing can take a few seconds to a few hours, depending on the
software launched, the options set in the process configuration, the size of the sample and the server load.
The base human configurations with vidjil-algo are « TRG », « IGH », « multi » (-g germline), « multi+inc » (-g germline -i), « multi+inc+xxx » (-g germline -i -2, default advised configuration).
See Libraries and recombinations for information on these processes.
There are also processes for other species and for other RepSeq algorithms, such as « MiXCR ».
The server maintainers can add new process configurations tailored to specific needs, contact us if you have other needs.
The « reload » button (bottom left) updates the view. It is useful to see if the status of the task changed.
It should do PREPROCESSING (optional) → QUEUED → RUNNING → COMPLETED.
It is possible to launch several processes at the same time (some will wait in the QUEUED states), and also to launch processes while you
are uploading data. Finally, you can safely close the window with the sample database (and even your web browser) when some process are queued/launched.
The only thing you should not do is to close completely your web browser (or the webpage) while sequences are uploading.
Once a task is completed, a click on the See results link (bottom right) will open the main window to browse the clonotypes.
A click on the out link at the right of every sample give access to the raw output file of the RepSeq software.
Displaying statistics, quality control⚓︎
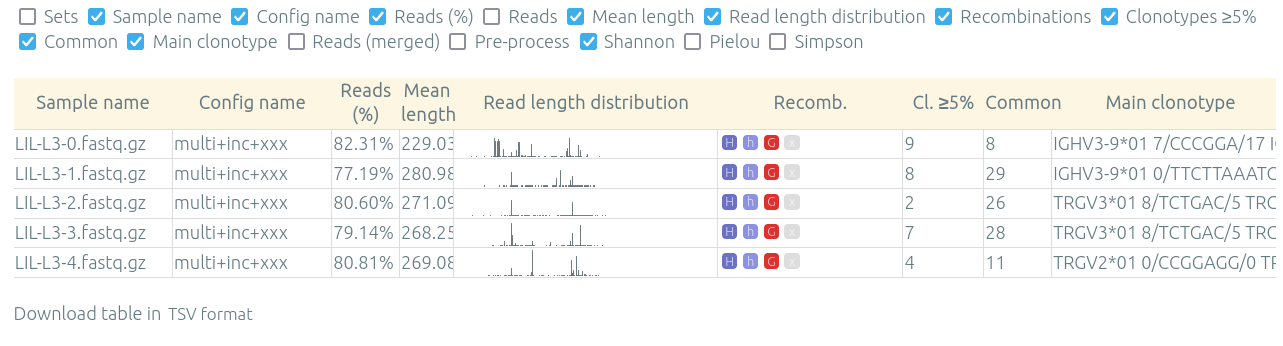
The "Preview / quality control" allow to see in one table various information on results for multiple samples from one patient, run, or set, for a specified configuration (that was already processed).
The Download table (.tsv) button under the table allow you to process these statistics in an external tool.
This page can be accessed through a button either from a patient/run/set page, or from the main page on the sample database listing patients/runs/sets
The columns (list below) can be showed or hidden using the checkboxes above the table. Displayed and hidden columns are saved in your local settings.
| Columns | Explanation |
|---|---|
| Sets | Patients, runs, sets |
| Sample name | Sample name |
| Config name | Analysis configuration (such as multi+inc+xxx) |
| Reads (%) | Percentage of analyzed reads |
| Reads | Number of analyzed reads / Total number of reads |
| Mean length | Mean length of the reads |
| Read length distribution | Read length distribution (between 100bp and 600bp) |
| Recombinations | Recombinations / loci |
| Clonotypes ≥5% | Number of clonotypes above 5% in their recombination/locus |
| Common | Common clonotypes ≥0.01% with other samples of this set. Note that these are the common clonotypes with all samples of the set, even if they are not displayed. |
| Main clonotype | Main clonotype |
| Reads (merged) | Number of merged reads |
| Pre-process | Pre-process |
| Shannon | Shannon's diversity (0: no diversity, 3-5+: full diversity) |
| Pielou | Pielou's evenness (0: no diversity, 1: full diversity) |
| Simpson | Simpson's diversity (0: no diversity, 1: full diversity) |
Groups⚓︎
Each patient, run or set is assigned to at least one group. Users are assigned to different groups and therefore gain access to any patients, runs or sets that said group has access to.
Groups may be nested. For example, a group may represents an organization, such as a hospital or a network of hospitals. Subgroups may be created for individual labs and/or for different roles in the labs. This allows users to have different sets of permissions while accessing to some of the files uploaded to the organization's group.
Users may be a part of several groups. By default Users are assigned their personal group to which they can upload files and be the sole possessor of an access to this file. Different groups imply different sets of permissions. A user may not have the same permissions on a file accessed from an organization's group as (s)he does on files from her/his personal group, or even from a group associated to another organization.
The different permissions that can be attributed are:
- Read: Permissions to view patients/runs/sets to which a group or organization has access to
- Create: Permissions to create patients/runs/sets
- Upload: Permissions to upload samples to the patients/runs/sets of a group
- Run: Permissions to run Vidjil on an uploaded samples to the patients/runs/sets of a group
- (Anon) View Details: Permissions to view patient/run/set data in an unencrypted manner for the patients/runs/sets of a group
- Save: Permissions to save an analysis for the patients/runs/sets of a group
Usage and processes pages⚓︎
These pages allow to follow your activity and the activity of your groups.
Usage page⚓︎
The usage page detail, for each of your groups, data usage and last processes. For each group, you will find:
- A reminder of your permissions in that group (full permissions: admin anon create read run save upload, or some more restricted permissions)
- The number of each type of sets (patient/runs/sets), with the number of processes done the last month and their status
(
C: completed,F: failed,Q: queued,S: stopped) - The list of the most frequent tags
- Links to last processes
Processes page⚓︎
This page lists the last processes you ran, with information such as its configuration and its status. Each sample is provided with links to the related patient/runs/sets.
Edit my personal information⚓︎
Your login is your email address. To update other personal information or your password, on the database page, click on the pen icon next to your name. Change them wisely.
See also the Vidjil privacy policy and our compliance to the GDPR.
How do you define clones, their sequences, their V(D)J designation and their productivity?⚓︎
The Vidjil web application allows to run several RepSeq algorithms. Each RepSeq algorithm (selected by « process configuration », see above) has its own definition of what a clone is (or, more precisely a clonotype), how to output its sequence and how to assign a V(D)J designation. Knowing how clonotypes are defined is important to be aware of the potential biases that could affect your analysis.
How do you define a clonotype? How are gathered clonotypes?⚓︎
Some RepSeq studies want to broadly cluster clonotypes to have a global view on the immune repertoire. One may want to focus on CDR3 on the amino-acid level, or on the nucleotide level. One also generally wants to correct technological artifacts (PCR, sequencing). On the contrary, when studying hypermutations in IGH recombinations, people want to know as precisely as possible differences between sequences, even when they occur for a single nucleotide in the V gene or elsewhere.
In vidjil-algo (Giraud, Salson, BMC Genomics 2014), sequences are gathered into a same clonotype as long as they share the same 50bp DNA sequence around the CDR3 sequence. In a first step, the algorithm has a quick heuristic which detects approximately where the CDR3 lies and extracts a 50bp nucleotide sequence centered on that region. This region is called a window in vidjil-algo. When two sequences share the same window, they belong to the same clonotype. Therefore in vidjil-algo clonotypes are only defined based on the (conservative) exact match of a long DNA sequence. This explains why some small clonotypes can be seen around larger clonotypes: They may be due to artifacts that lead to different windows. However those small differences can also be due to a real biological process inside the cells. Therefore we let the user choose whether the clonotypes should be manually clustered or not -- and the choice may depend on the purpose of her study.
In MiXCR, clonotypes are defined based on the amino-acid CDR3 sequence, on the V gene used and on the hypermutations. Other software may have other definitions, see also What is a clone ?.
What is the sequence displayed for each clonotype?⚓︎
The sequences displayed for each clonotype are not individual reads.
The clonotypes may gather thousands of reads, and all these reads can have
some differences. Depending on the sequencing technology, the reads
inside a clonotype can have different lengths or can be shifted,
especially in the case of overlapping paired-end sequencing. There can be also
some sequencing errors.
The .vidjil file has to give one consensus sequence per clonotype, and
RepSeq algorithms have to deal with great care to these difference in
order not to gather reads from different clonotypes.
For vidjil-algo, it is required that the window centered on the CDR3 is exactly shared by all the reads. The other positions in the consensus sequence are guaranteed to be present in at least half of the reads. The consensus sequence can thus be shorter than some reads.
How are computed the V(D)J designations?⚓︎
In vijdil-algo, V(D)J designations are computed after the clonotype clustering by dynamic programming, finding the most similar V (or 5') and J (or 3') gene, then trying to match a D gene. Note that the algorithm also detects some VDDJ or VDDDJ recombinations that may happen in the TRD locus. Some incomplete or unusual rearrangements (Dh/Jh, Dd2/Dd3, KDE-Intron, mixed TRA-TRD recombinations) are also detected.
Once clonotypes are selected, you can send their sequence to IMGT/V-QUEST and IgBlast by clicking on the links just above the sequence panel (bottom left). This opens another window/tab.
Why do some clonotypes not have V(D)J designations?⚓︎
In a first step, vidjil-algo detects and cluster clonotypes that have significant similarities to both V and J regions. In a second step, vidjil-algo designates V, (D), and J genes on the clonotypes. Sequences without V(D)J designations are the ones that successfully went through the first step but not through the second step.
Such sequences can be actual clones that need to be investigated, especially clones with unusual recombinations, such as translocations. They can be also spurious clones: For example low-complexity sequences may share significant regions to low-complexity regions of V or J genes. Such spurious clones may appear especially on large datasets coming from full RNA-seq or whole-genome sequencing.
Once these clonotypes as selected, you can send their sequences to Blast or to IgBlast and/or to share us these sequences
(with help > get support, see below) for further inspection.
How is productivity computed? Why do I have some discrepancies with other software?⚓︎
Vidjil-algo reports CDR3 as productive when they come from
an in-frame recombination, the sequence does not contain any in-frame stop codons,
and, for IGH recombinations, when the FR4 begins with the {WP}-GxG pattern.
This follows the ERIC guidelines (Rosenquist et al., 2017).
The productivity as computed by Vidjil-algo may differ from what computes other software. For instance, as of September 2019, IMGT/V-QUEST removes by default insertions and deletions from the sequences to compute the productivity, as it considers them as sequencing errors.
How can there be discrepancies in annotations of a same clonotype in different samples?⚓︎
Sometimes, the "same" clonotype shows different properties between different samples -- as for example different V(D)J designations or productivity prediction. Warnings W81 and W82 are now raised for such situations.
Such differences may come from the way sequences are clustered. When different sequences are clustered in a "same" clone, some of them may actually have different mutations or lengths even if they share the same window. This can also be due to clustering results of different analysis programs, for example with different releases of vidjil-algo.
Can I see all the clones and all the reads?⚓︎
The interest of NGS/RepSeq studies is to provide a deep view of any V(D)J repertoire. The underlying analysis softwares (such as vidjil-algo) try to analyze as much reads as possible (see Number of analyzed reads below). One often wants to "see all clones and reads", but a complete list is difficult to see in itself. In a typical dataset with about 106 reads, even in the presence of a dominant clonotype, there can be 104 or 105 different clonotypes detected. A dominant clonotype can have thousands or even more reads.
Whereas many applications require to focus on some clonotypes with their consensus sequences, repertoire studies usually consider all clonotypes, for example to assess their diversity or to compare repertoires between samples. Vidjil allows both:
- by default, to fully study "top clonotypes"
- when this is needed, to retrieve the full list of clonotypes and/or reads for further analysis
- to study the distribution of all the clonotypes
- to estimate diversity and overlap indices
The "top" slider in the "filter" menu⚓︎
The "top 50" clonotypes are the clonotypes that are in the first 50 ones in at least one sample. As soon as one clonotype is in this "top 50" list, it is displayed for every sample, even if its concentration is very low in other samples. This is the case for clonotypes tracked in follow-up samples (for example checking minimal residual disease, MRD) after a diagnosis sample.
Most of the time, a "top 50" is enough. The hidden clonotypes are thus the one that never reach the 50 first clonotypes. With a default installation, the slider can be set to display clonotypes until the "top 100" on the grid (and, on the graph, until "top 20").
However, in some cases, one may want to track some known clonotypes that are never in the "top 100", as for example:
- a standard/spike with low concentration
- a clonotype tracked in a follow-up sample of a patient without the diagnosis sample
In these situations, a solution is to create a .fasta file with this sequences to be tracked
and upload it as another sample in the same patient/run/set.
It should then show up in any sample.
(Upcoming feature). If clonotype is "tagged" in the .vidjil or
in the .analysis file, it will always be shown even if it does not
meet the "top" filter.
Studying the distribution of all clonotypes, including "smaller clonotypes"⚓︎
Vidjil detects all clonotypes, even if, by default, only the top 50 or 100 clonotypes are displayed with a full analysis. The other clonotypes, that are hidden (because of the "top" or because of hiding some tags) are gathered into virtual clonotypes, shown with light gray.
This enables to study full repertoires,
including assessing the polyclonal background and the diversity of the repertoires.
Note that selecting color by clonotype emphasizes the difference between the top clonotypes, colored, and these virtual clonotypes.
Depending on the process configuration, these "smaller clonotypes" are shown, in the clonotype list:
-
either gathered by read length, the Genescan-like plot showing the clonotype distribution. This is the default on default processes on the public server,
-
or gathered by locus into a unique virtual clonotype.
In both cases, the sum of ratios in the list of clonotypes is always 100%: thus these "smaller clonotypes" changes when one uses the "filter" menu.
Note that the ratios include the "smaller clonotypes": if a clonotype is reported to have 10.54%, this 10.54% ratio relates to the number of analyzed reads, including the hidden clonotypes.
Studying diversity and overlap indices⚓︎
Several indices are computed on the full list of clonotypes to assess the diversity and overlap of sample(s):
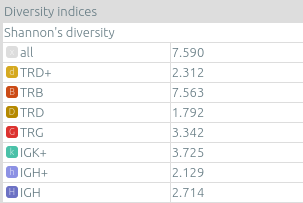
- On one sample, diversity indices such as Shannon's diversity, Pielou's evenness, and Simpson's diversity, as computed by vidjil-algo. Pielou's evenness and Simpson's diversity have values between 0 (no diversity, one clonotype clusters all analyzed reads) and 1 (full diversity, each analyzed read belongs to a different clonotype).
- On several samples, overlap indexes such as Morisita's overlap index having values between 0 (no overlap between the two samples) and 1 (full overlap, clonotypes in the same proportion in both samples).
Some of these indices are shown on the sample information panel (“🛈” next to the sample name in the info panel). Contact us if you have other needs.
Exporting the full list of clonotypes⚓︎
The Export all clonotypes (AIRR) process exports all clonotypes
in the AIRR format.
Such a .tsv file that can be further processed or opened in any spreadsheet editor.
The exported fields are described in the documentation of vidjil-algo.
Once the process has run, click on See the output files (at the right of COMPLETED)
to download this file.
Note that results can then not be visualized on the main Vidjil window.
For more specific analyses, we advise to work with bioinformaticians.
The full list of clonotypes can be retrieved by launching the command-line vidjil-algo (see documentation),
Parsing the .vidjil files gives then all information computed on each clonotype (see documentation).
Going back to the analyzed reads⚓︎
The web application displays one consensus sequence per clonotype (see Representative above). In some situations, one may want to go back to the reads.
For vidjil-algo, analyzing a dataset with the default + extract reads process
generates a .detected.vdj.fa file with the reads with detected V(D)J recombinations.
This file can be downloaded through the See the output files link near each sample.
It enables to use vidjil-algo as a filtering tool,
shrinking a large read set into a manageable number of (pre-)clonotypes
that will be deeply analyzed and possibly further clustered by
other software.
Other custom processes are possible, in particular to retrieve reads for a particular clonotype. Contact us if you are interested.
How can I assess the quality of the data and the analysis ?⚓︎
To make sure that the PCR, the sequencing and the RepSeq analysis went well, several elements can be controlled.
Number of analyzed reads⚓︎
A first control is to check the number of “analyzed reads” in the info panel (top left box). This shows the number of reads where the underlying RepSeq algorithm found some V(D)J recombination in the selected sample.
With DNA-Seq sequencing with specific V(D)J primers, ratios above 90% usually mean very good results. Smaller ratios, especially under 60%, often mean that something went wrong. On the other side, capture with many probes or RNA-Seq strategies usually lead to datasets with less than 0.1% V(D)J recombinations.
The sample information panel (“info“ button) further details the causes of non-analysis (for vidjil-algo, UNSEG, see detail on vidjil-algo documentation.
There can be several causes leading to low ratios:
Analysis or biological causes⚓︎
-
The data actually contains other germline/locus that what was searched for (solution: relaunch the processing, or ask that we relaunch it, with the correct germline sequences). See locus documentation for information on the analyzable human locus with vidjil-algo, and contact us if you would like to analyze data from species that are not currently available.
-
There are incomplete/exceptional recombinations (Vidjil can analyze some of them with the process
multi+inc, see locus documentation for details) -
There are too many hypersomatic mutations (usually Vidjil can process mutations until 10% mutation rate… above that threshold, some sequences may be lost).
-
There are chimeric sequences or translocations (Vidjil does not process all of these sequences).
PCR or sequencing causes⚓︎
-
The read length is too short and the reads do not span the junction zone (see also comments on read length concerning library preparation and sequencing). Vidjil-algo detects a “window” including the CDR3. By default this window is 50bp long, so the read needs be that long centered on the junction. Reads with no similarity to either V or J are reported as not analyzed (
UNSEG only V/Jor evenUNSEG too few V/J). Reads with a V/J junction detected but not long enough are also reported as not analyzed (UNSEG too short w). Finally, some slightly short reads are analyzed but with slightly shifted or shortened windows (SEG changed w). The related clonotypes are marked with a W50 warning, as they may, in some cases, falsely cluster reads from different clonotypes. -
In particular, for paired-end sequencing, one of the ends can lead to reads not fully containing the CDR3 region. Solutions are to merge the ends with very conservative parameters (see Read merging above), to ignore this end, or to extend the read length.
-
There were too many PCR or sequencing errors (this can be asserted by inspecting the related clonotypes, checking if there is a large dispersion around the main clonotype)
Control with standard/spike⚓︎
- If your sample included a standard/spike control, you should first identify the main standard sequence (if that is not already done) and specify its expected concentration (by clicking on the “★” button). Then the data is normalized according to that sequence.
- You can (de)activate normalization in the settings menu.
Steadiness verification⚓︎
- When assessing different PCR primers, PCR enzymes, PCR cycles, one may want to see how regular the concentrations are among the samples.
- When following a patient one may want to identify any clonotype that is emerging.
- To do so, you may want to change the color system, in the “color by” menu select “abundance”. The color ranges from red (high concentration) to purple (low concentration) and allows to easily spot on the graph any large change in concentration.
Clonotype coverage⚓︎
In vidjil-algo, the clonotype coverage is the ratio of the length of the clonotype consensus sequence to the median read length in the clonotype. A consensus sequence is displayed for each clonotype (see What is the sequence displayed for each clonotype?). Its length should be representative of the read lengths among that clonotype. A clonotype can be constituted of thousands of reads of various lengths. We expect the consensus sequence to be close to the median read length of the clonotype. The clonotype coverage is such a measure: having a clonotype coverage between .85 and 1 is quite frequent. On the contrary, if it is .5 it means that the consensus sequence length is half shorter than the median read length in the clonotype.
There is a bad clonotype coverage (\< 0.5) when reads do share the same window (it is how Vidjil defines a clonotype) and when they have frequent discrepancies outside of the window. Such cases have been observed with chimeric reads which share the same V(D)J recombinations in their first half and have totally different and unknown sequences in their second half.
In the web application, the clonotypes with a low clonotype coverage (\< 0.5) are displayed in the list with an orange I on the right. You can also visualize the clonotypes according to their clonotype coverage by selecting for example “clonotype coverage/GC content” in the preset menu of the “plot” box.
E-value⚓︎
Vidjil-algo computes an e-value of the found recombination. An e-value is the number of times such a recombination is expected to be found by chance. The lower the e-value the more robust the detection is.
Whenever the e-value is too large, a warning sign will be shown next to the clonotype, instead of the info icon.
How to work with primers?⚓︎
Displaying primers⚓︎
Library preparation may involve some usual sets of primers.
To display the primers,
select such a primer set with settings -> primer set.
This aligns the clonotype sequences against the selected primer set.
It works even with approximate matches and/or degenerate primers.
Note that retrieving the positions may take a few seconds to about one minute when many clonotypes and/or samples are opened.
Primers are then displayed
- on the clone information panel (line
Primer 5orPrimer 3) - on the sequence aligner (
☰ Sequences features>Primers)
Moreover, when one or both primers are not found in the clonotype sequence,
their position will nevertheless be estimated "outside" of the read, based on the germline sequence
(but this is not displayed).
This will allow to estimate an interpolated length for such clonotypes,
that is plot in a Genescan-like view (preset Primer gap).
Removing primers before external analysis⚓︎
As they are (mostly) conserved across reads, primers can bias some analyses such as the hypermutations rate.
They can be removed before sending the sequence to external tools (IMGT/V-Quest, IgBlast, Blast, or AssignSubset).
You should have previously select a primer set,
open the settings menu, select trim primers for external tools.
The sequences sent for external analysis will then be trimmed at primers positions, even if only one primer was found.
How can I have further support or help on a specific sample or on some sequences?⚓︎
When you have questions on specific data, we advise to use the help > get support
link inside the web application.
This opens a mail template with reference to the sample,
and possibly with references to the selected clonotypes.
Indeed, the address https://app.vidjil.org/3241-25?clone=3 reflects the sample you are studying with a given process configuration. When you select one or several clones, the address is updated.
Note that, even knowing this address, only the logged-in users with proper authorization can access to these data. This includes the uploader of the data, possibly users of the same groups if such groups were defined, and the server maintainers.
Settings⚓︎
The settings menu allows to set:
- the clonotype size format [scientific notation / percentage]
- the sample key [sample name / shortened name / sampling date / day since first sampling]
- the format for clonotype junction [junction length / AA sequence / mixed (display AA sequence only for short junction)]
- the format for clonotype alleles [hide alleles / display alleles / mixed (display only for marginal alleles)]
These settings, together with the color option, are kept in your web browser localStorage between several sessions.
Available in version 2024.10 and later
This feature is only available starting from version 2024.10.
A new panel to manage settings is included. This panel allows you to import and export your local settings.
- Export: Two options are offered. You can choose to export all settings, including those from the settings menu, selection sequence features, and report templates. Alternatively, you can choose to export only the report templates.
- Import: You can provide your exported settings file. A log of the imported values is displayed under a dedicated menu.
- Reset: All settings are reset to their default values. Templates are also erased.
This panel is available at the bottom of settings menu under "manage settings" entry.
Keyboard shortcuts⚓︎
This section can be displayed by pressing the ? key on the keyboard. There is also a button in the help menu to display it.
Note that some shortcuts may not work on some systems or on some web browsers.
? |
Display this help |
← and → |
navigate between samples |
Shift-← and Shift-→ |
decrease or increase the number of displayed clonotypes |
numeric keypad, 0-9 |
switch between available plot presets |
# |
switch between grid and bar modes |
z |
zoom/focus on selected clonotypes |
Shift-z |
hide the selected clonotypes |
z or Shift-z with no clonotype selected |
reset the zoom/focus |
r |
add selected clonotype(s) to report |
Shift-r |
remove all clonotypes from report |
Ctrl-r |
open report menu with current selected sample and clonotypes |
+ |
cluster selected clonotypes |
Backspace |
revert to previous clusters |
a: TRA |
|
b: TRB |
|
g: TRG |
|
d: TRD, TRD+ |
change the selected germline/locus |
h: IGH, IGH+ |
|
l: IGL |
|
k: IGK, IGK+ |
|
x: xxx |
Note: You can select just one locus by holding the Shift key while pressing
the letter corresponding to the locus of interest.
Ctrl-s |
save the analysis (when connected to a database) |
Shift-p |
open the database panel (when connected to a database) |
Configurations⚓︎
A list of mainstream configurations is given below.
These description include vidjil-algo and fuse parameters if you want to recreate them locally or on your own server.
| Program | The selection to do in process creation on server interface |
| Command | Parameters given to vidjil-algo |
| Fuse command | Parameter given to fuse script |
If you want have access to configuration listed below, or ask for a specific configuration fitting your need, it can be done by email us at contact@vidjil.org.
Note that some specifics, in progress or unmaintained existent configurations are not shown here.
Group 'Human V(D)J recombinations'⚓︎
Analysis with vidjil-algo of human TR/IG recombinations. This is a group of most common configurations to use for analysis.
multi+inc+xxx (default configuration)⚓︎
default: multi-locus, with some incomplete/unusual/unexpected recombinations
Parameters
program: vidjil
command: -c clones -z 100 -r 1 -g germline/homo-sapiens.g  -e 1 -2 -d -w 50 -y all --no-airr
fuse_command: -t 100 -d lenSeqAverage --overlaps
IGH⚓︎
Locus IGH, Vh(Dh)Jh
Parameters
program: `vidjil`
command: `-w 60 -c clones -z 100 -r 1 -g germline/homo-sapiens.g:IGH  -d -y all  --no-airr`
fuse_command: `-t 100 -d lenSeqAverage --overlaps`
TRG⚓︎
Locus TRG, VgJg
Parameters
program: `vidjil`
command: `-c clones -z 100 -r 1 -g germline/homo-sapiens.g:TRG  -y all --no-airr`
fuse_command: `-t 100 -d lenSeqAverage --overlaps`
multi⚓︎
Multi-locus, only complete locus
Parameters
program: `vidjil`
command: `-c clones -z 100 -r 1 -g germline/homo-sapiens.g:IGH,IGK,IGL,TRA,TRB,TRG,TRD  -e 1 -w 50  -d -y all --no-airr`
fuse_command: `-t 100 -d lenSeqAverage --overlaps`
Clonality⚓︎
Incomplete germlines + larger window (90bp), thus 20bp more on each side. This configuration is advised for studies on IGH clonality
Parameters
program: `vidjil`
command: `-c clones -z 100 -r 1 -g germline/homo-sapiens.g -e 1 -2 -w 90 -y all --no-airr`
fuse_command: `-t 100 -d lenSeqAverage --overlaps`
IGK⚓︎
Locus IGK, including KDE and Intron recombinations
Parameters
program: `vidjil`
command: `-c clones -z 100 -r 1 -g germline/homo-sapiens.g:IGK,IGK+ -y all --no-airr`
fuse_command: `-t 100 -d lenSeqAverage --overlaps`
IGL⚓︎
Locus IGL
Parameters
program: `vidjil`
command: `-w 60 -c clones -z 100 -r 1 -g germline/homo-sapiens.g:IGL  -d -y all  --no-airr`
fuse_command: `-t 100 -d lenSeqAverage --overlaps`
Group 'Other recombinations⚓︎
Analysis with vidjil-algo of human non-V(D)J recombinations This set of configurations includes some specific analysis.
IGH/isotypes⚓︎
Multi-locus, with IgH constant chains
(before: -g /home/vidjil-ci/custom-germlines/germlines-classes.data)
Parameters
program: `vidjil`
command: `-c clones -z 100 -r 1 -g germline/homo-sapiens-isotypes.g  -e 1 -2 -d -w 50 --no-airr`
fuse_command: `-t 100 --overlaps`
IKZF1/ERG⚓︎
Experimental search of intronic deletions (IKZF1, ERG)
Parameters
program: `vidjil`
command: `-c clones -z 100 -g germline/homo-sapiens-isoforms.g -e 1 -2 -d -w 50 -r 1 -y all  --no-airr`
fuse_command: `-t 100 -d lenSeqAverage --overlaps`
IGH+⚓︎
Locus IGH+ (DJ)
Parameters
program: `vidjil`
command: `-c clones -z 100 -r 1 -g germline/homo-sapiens.g:IGH+ -e 1 -2 -d -w 50 -y all --no-airr`
fuse_command: `-t 100 -d lenSeqAverage  --overlaps`
IGH/IGH+⚓︎
Locus IGH, Vh(Dh)Jh
Parameters
program: `vidjil`
command: `-w 60 -c clones -z 100 -r 1 -g germline/homo-sapiens.g:IGH,IGH+  -d -y all  --no-airr`
fuse_command: `-t 100 -d lenSeqAverage --overlaps`
IGL/IGK⚓︎
Locus IGK/IGH+; IGL
Parameters
program: `vidjil`
command: `-w 60 -c clones -z 100 -r 1 -g germline/homo-sapiens.g:IGK,IGK+,IGL  -d -y all  --no-airr`
fuse_command: `-t 100 -d lenSeqAverage --overlaps`
Group 'Analysis with/for other software'⚓︎
Analysis that use other repertoire software or generate with vidjil-algo compatible output formats
MiXCR⚓︎
Warning
deprecated since MiXCR now requires a licence to run. Please contact us if you'd like to discuss this with us
MiXCR. Run a version of MixCR from 2018.
Parameters
program: `mixcr`
command: `| -OaddReadsCountOnClustering=true |`
fuse_command: `-t 100`
Export all clones (AIRR)⚓︎
Export all clones in the tabular AIRR format. A threshold of 5 reads is set to report a clonotype. The results cannot be browsed online.
See documentation
Another similar configuration with a limit set to 1 reads is available but only on demand and for small set of sequences.
The results cannot be browsed online.
Parameters
program: `vidjil`
command: `-c clones -y all -z all  -g germline/homo-sapiens.g -e 1 -2 -d -w 50 -r 5 --no-vidjil`
fuse_command: `-t 100`
Group 'Other species'⚓︎
Analysis with vidjil-algo of V(D)J recombinations for other species. Contact us at support@vidjil.org should you need other species.
Mus musculus⚓︎
Mus musculus, multiple locus
Parameters
program: `vidjil`
command: `-c clones -z 100 -r 1 -g germline/mus-musculus.g -d --no-airr`
fuse_command: `-t 100 --overlaps`
Gallus gallus⚓︎
Analyze IGH and IGL recombinations for Gallus gallus Analyze also some incomplete/unusual/unexpected recombinations.
Parameters
program: `vidjil`
command: `-c clones -z 100 -r 1 -g germline/gallus-gallus.g -e 1 -2 -d -w 50 --no-airr`
fuse_command: `-t 100  --overlaps`
Sus Scrofa⚓︎
Analyze IGH, IGL and TRB recombinations for Sus scrofa. Analyze also some incomplete/unusual/unexpected recombinations.
Parameters
program: `vidjil`
command: `-c clones -z 100 -r 1 -g germline/sus-scrofa.g -e 1 -2 -d -w 50 --no-airr`
fuse_command: `-t 100 --overlaps`
Group 'Experimental configs'⚓︎
Experimental analyses, under development. These configuration may evolve or moved into other groups without notice.
vidjil-algo-next⚓︎
Default configuration, beta release of next vidjil-algo engine.
Parameters
program: `vidjil`
command: `next -c clones --no-airr -z 100 -r 1 -g germline/homo-sapiens.g -e 1 -2 -d -w 50 --no-airr`
fuse_command: `-t 100`
Multi + contigs⚓︎
Experimental; default multi+inc+xxx configuration + pre-fuse script for creation of contigs on the top 5 of clones from raw reads.
Run script capture_contigs.py available in contribution repository and developed with Nantes CHU team (publication to come).
Parameters
program: `vidjil`
command: `-w 60 -c clones -z 100 -r 1 -g germline/homo-sapiens.g -d -y all --no-airr`
fuse_command: ` -t 100 -d lenSeqAverage --overlaps --pre "rnaseq_contigs.py --adaptater-length 6" `
IGH + contigs⚓︎
Same as Multi+contigs, but limit to IGH complete locus.
Parameters
program: `vidjil`
command: `-w 60 -c clones -z 100 -r 1 -g germline/homo-sapiens.g:IGH -d -y all --no-airr`
fuse_command: ` -t 100 -d lenSeqAverage --overlaps --pre "rnaseq_contigs.py --adaptater-length 6" `
Export all clones (AIRR), limit 1 read⚓︎
Export all clones in the tabular AIRR format, from 1 read. Use wisely on files with few clonotypes. The results cannot be browsed online. See documentation
Parameters
program: `vidjil`
command: ` -c clones -y all -z all -g germline/homo-sapiens.g -e 1 -2 -d -w 50 -r 1 --no-vidjil `
fuse_command: ` -t 100 `
References⚓︎
If you use Vidjil for your research, please cite the following references:
Marc Duez et al., “Vidjil: A web platform for analysis of high-throughput repertoire sequencing”, PLOS ONE 2016, 11(11):e0166126 https://doi.org/10.1371/journal.pone.0166126
Mathieu Giraud, Mikaël Salson, et al., “Fast multiclonal clusterization of V(D)J recombinations from high-throughput sequencing”, BMC Genomics 2014, 15:409 https://doi.org/10.1186/1471-2164-15-409